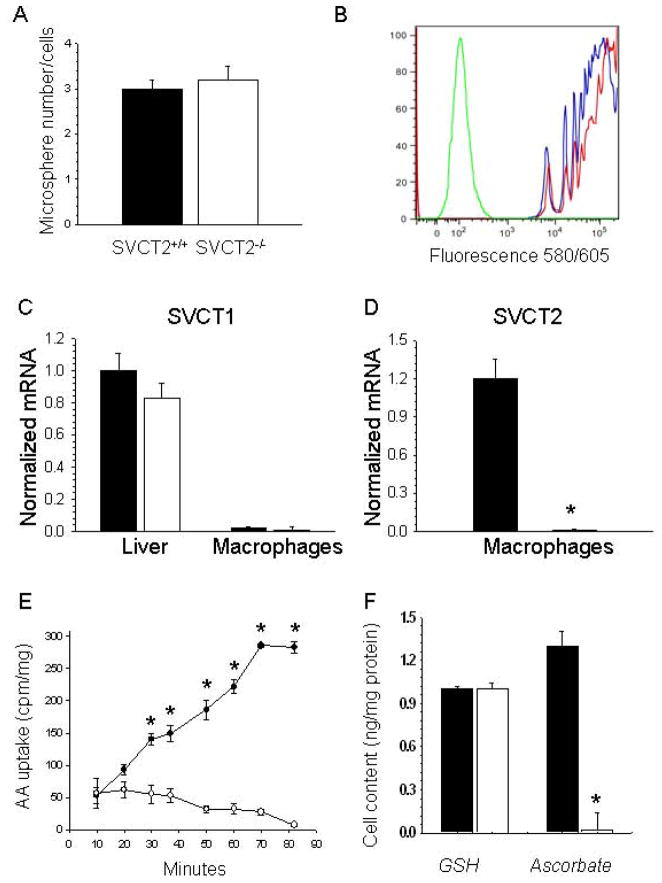
Figure 2.
Macrophage phagocytosis and ascorbate transporter expression and function. Liver tissue and peritoneal macrophages were isolated from apoE−/− mice reconstituted either with SVCT2+/+ (■) or SVCT2−/− (□) FLCs. Phagocytosis of fluorescent microspheres was allowed to continue for 1 hour at 37°C, followed either by counting of macrophage bead content (A) or by flow cytometry (B). For (B), the green line represents control non-phagocytosing macrophages, the red line macrophages from mice transplanted with SVCT2−/− FLCs, and the blue line macrophages from mice that received SVCT2+/+ FLCs. Gene expression levels of SVCT1 (C) and SVCT2 (D) were measured in liver and macrophages by real-time PCR. Graphs show results from 3 mice per group, with an asterisk indicating p < 0.05 compared to the control group. Radiolabeled ascorbate uptake over 90 min was measured in peritoneal macrophages in 4 experiments, with an asterisk indicating p < 0.05 compared to time zero (E). Macrophage ascorbate and GSH were measured in macrophages from each group that were cultured for 2 days after harvesting (F). Results are shown from 4 experiments, with an asterisk indicating p < 0.05 compared to control ascorbate.

