
Fig.2.
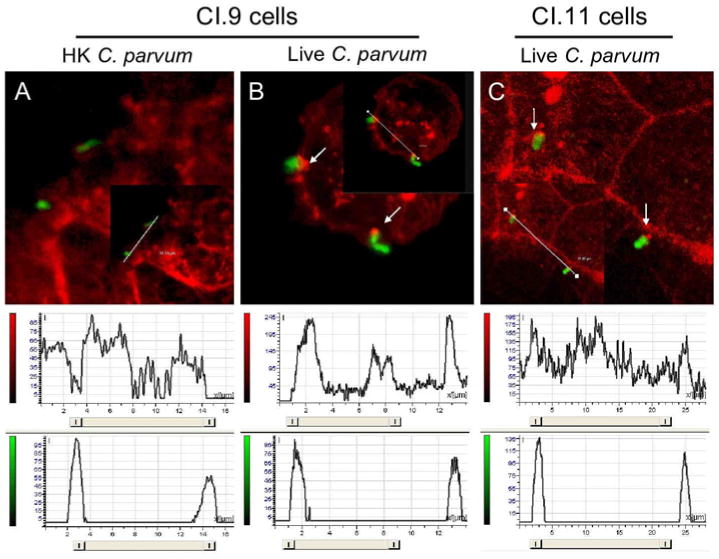
Analysis of actin-dense plaque formation at the site of C.parvum infection by confocal microscopy. Red fluorescence (actin staining). Green fluorescence (sporozoite staining). Below, histograms from fluorescence intensity profiles along the white lines as analyzed by Leica LcsLife confocal software. A. CI.9 cells exposed to heat killed C. parvum sporozoites. B. CI.9 cells exposed to live C. parvum sporozoites. C. CI.11 cells exposed to live C. parvum sporozites. The data are representative of three independent experiments.