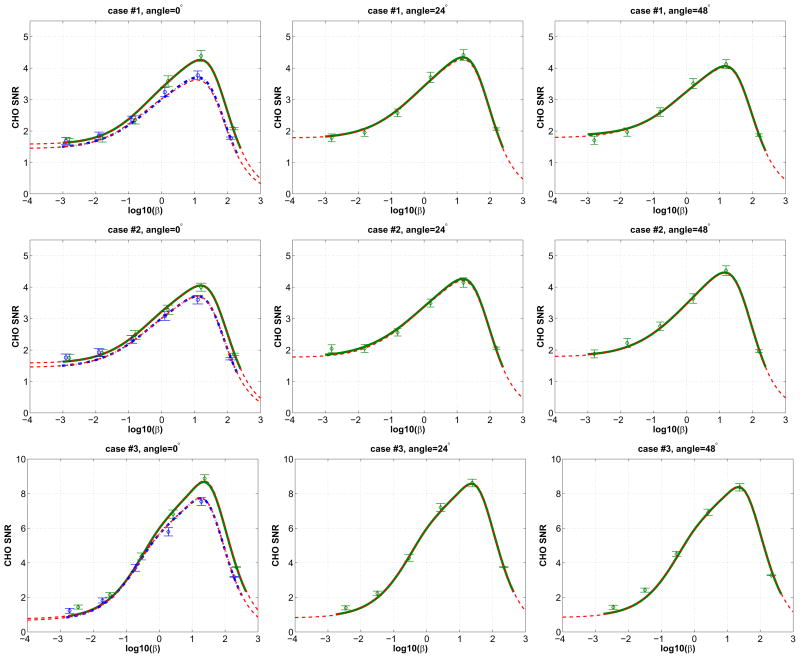
Fig. 11.
Comparisons between the Monte Carlo reconstruction based CHO SNR results and the theoretical predictions. Green solid lines are theoretical predictions of the ZiPET CHO SNR curves from the noise-free data using P(0°) (left column), P(24°) (middle column), and P(48°) (right column), respectively. Blue dash-dotted lines in the left column are theoretical predictions of the microPET II scanner from the noise free data. Dashed lines are the predicted CHO SNR curves using noisy scout images and rotation symmetry with P(0°) for the two systems. Diamond and circle symbols denote the Monte Carlo reconstruction based results of the ZiPET and microPET II, respectively, with error bars representing the standard deviations.

