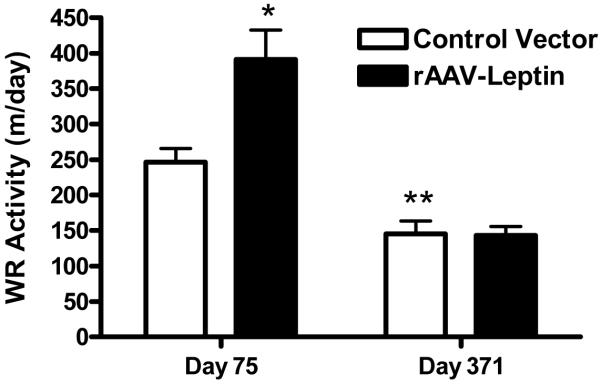
Figure 3.
Wheel running activity at day 75 and 371 after control (open bars) or leptin (solid bars) vector delivery. Wheel running was assessed for a 4-day period and average running activity during last 3 days is represented. Values represent the mean ± SE of 15-16 rats per group. P=0.007 for difference with leptin and P=0.001 for difference with days by two-way ANOVA. *P< 0.001 for difference with leptin treatment at day 75 by Bonferroni post-hoc analysis. **P<0.03 for difference between control day 75 and control day 371 by Bonferroni post-hoc analysis.

