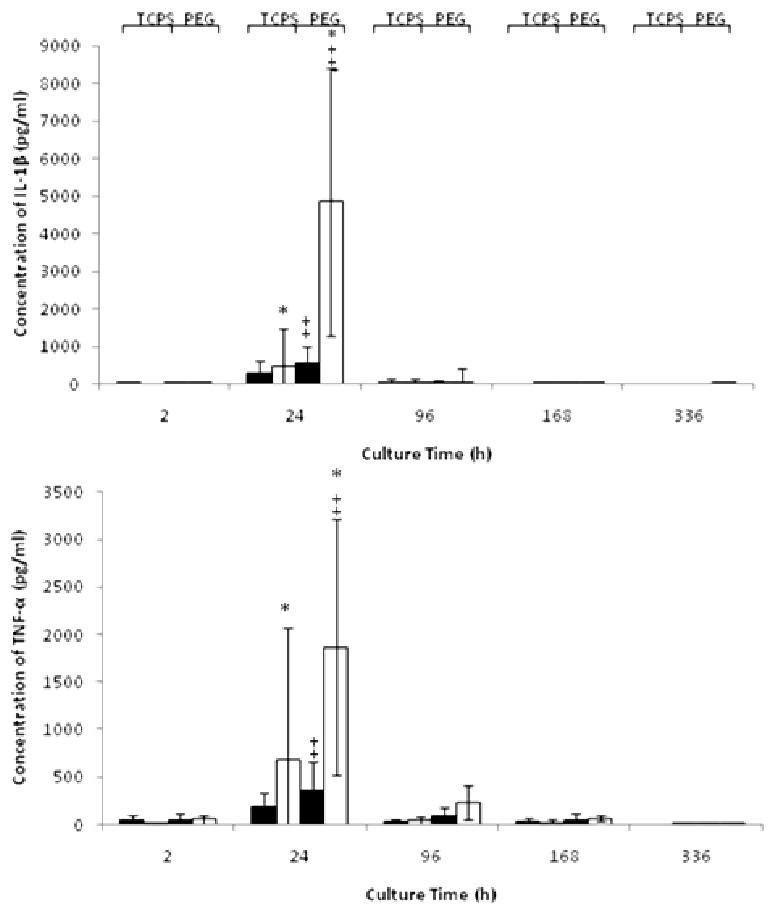
Figure 3.

Concentration (pg/ml) of IL-1β and TNF-α in the presence of TCPS or PEG cultured with FBS (▬) or AHS (▭). All data is presented as average ± standard deviation (n = 3 human blood donors).
*: Differs significantly from other serum type on same surface at same time point (p < 0.05)
‡: Differs significantly from other surface with same serum type at same time point (p < 0.05)
