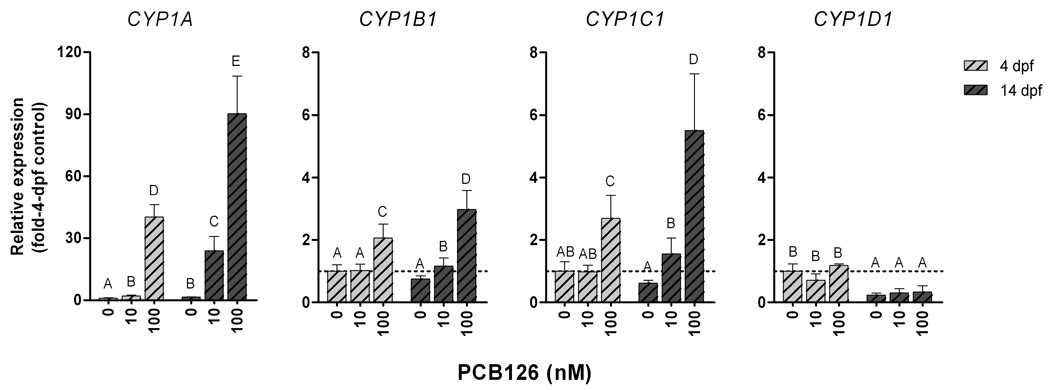
Figure 5.
Relative expression of CYP1A, CYP1B1, CYP1C1, and CYP1D in PCB126-exposed Xenopus tropicalis tadpoles at 4 days post-fertilization (dpf; light bars) and 14 dpf (dark bars). Starting 2 or 12 dpf groups of tadpoles were exposed for 24 hour to the carrier (0.1% acetone) or to 10 or 100 nM PCB126 plus carrier and subsequently held in clean water for another 24 hour before sampling. Calculations were made using β-actin as reference gene and the mean values of the different CYP1s in the 4-dpf carrier controls as calibrators (E−ΔΔCt). Statistically significant differences between groups were examined by one-way ANOVA followed by Tukey’s post-hoc test and are shown by different letters (p<0.05). Data are shown as mean ± SD (n = 5–6).

