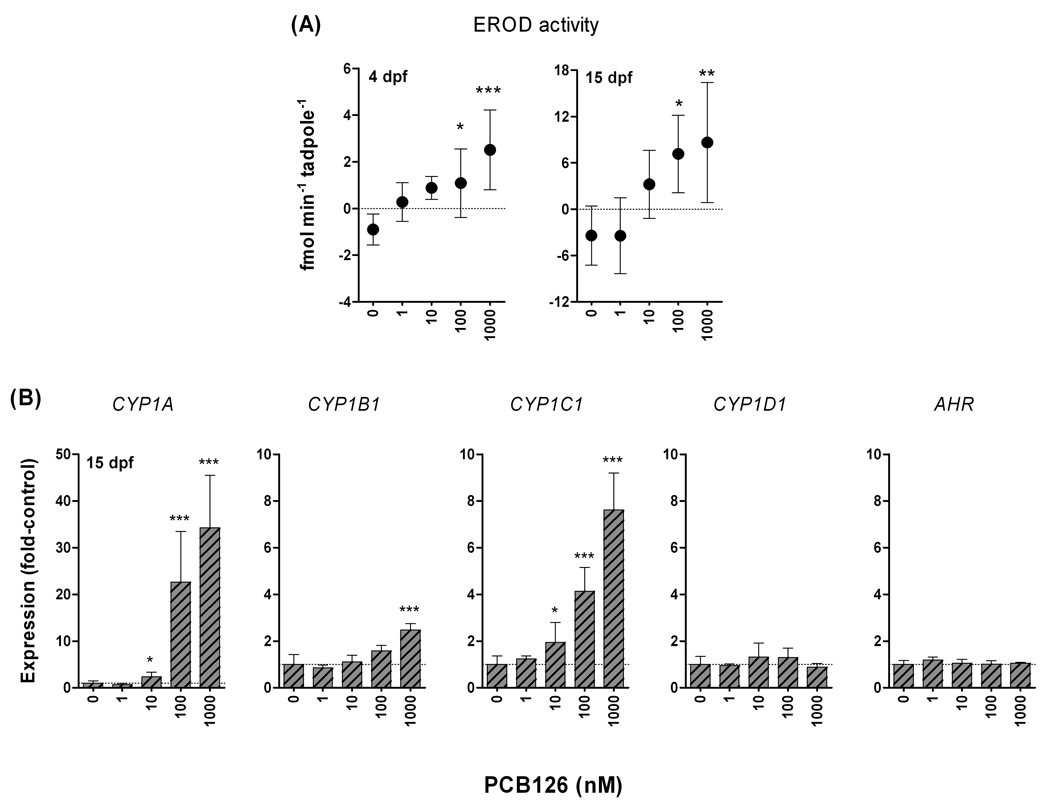
Figure 6.
Concentration-response relationships for PCB126 versus A) EROD activity (at 4 or 15 dpf) and B) relative expression of CYP1A, rbCYP1B1, rbCYP1C1, CYP1D1, and AHR (at 15 dpf) in Xenopus tropicalis. Tadpoles were exposed to the carrier (0.1% acetone) or to 1 nM - 1 µM PCB126 plus the carrier for 24 hours and subsequently held for 24 hours in clean water (at 26 °C). Calculation of gene expression was made using β-actin as reference gene and the mean values of the different CYP1s in carrier controls were used as calibrators (E−ΔΔCt). EROD activity was analyzed in 5–6 replicates. Gene expression was analyzed in six replicates of controls and three replicates of PCB126-exposed tadpoles. Statistically significant differences compared with the controls were examined by one-way ANOVA followed by Dunnett’s post hoc test and are shown by stars (***p<0.001, **p<0.01, and *p<0.05). Data are shown as mean ± SD.

