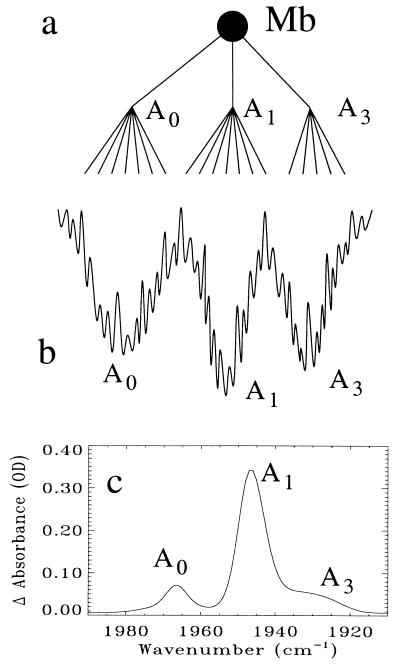
Figure 3.
(a) Tree diagram of the taxonomic substate of Mb and its numerous statistical substates. (b) Cross section through the hierarchical energy landscape. (c) Infrared spectrum of CO bound to the iron atom of Mb, showing the stretch frequencies of the three A substates. Allostery is a consequence of the existence of these taxonomic substates.

