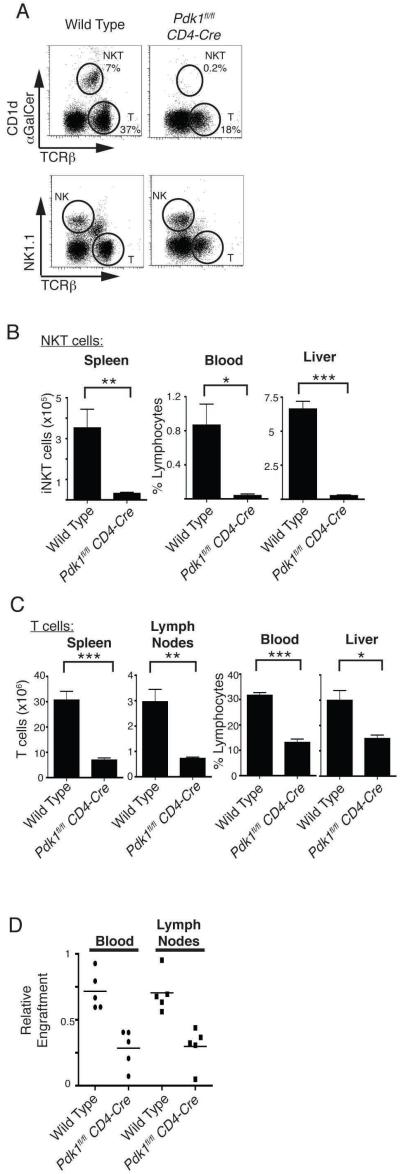
Figure 4. Analysis of peripheral lymphocyte subpopulations in Pdk1fl/fl CD4-Cre mice.
A. Analysis of the frequency of CD1d-αGalCer+/TCRβmid iNKT cells (top) and NK cells (bottom) in the liver. Also shown are conventional α/β T cells. Data is representative of 4 experiments. B. Total numbers/frequencies of iNKT cells in peripheral tissues. Data is mean +/− S.E.M of 3 experiments. C. T cell numbers/frequencies in peripheral tissues. Data shows the mean +/− S.E.M of 5-13 experiments (Spleen n=13; Lymph nodes n=5; Blood n=7; Liver n=6; * p<0.05, ** p<0.01, *** p<0.001). D. Congenially marked wild type (CD45.1) and Pdk1fl/fl CD4-Cre (CD45.2) thymocytes were mixed at a 1:1 ratio and injected into lymphopenic Rag2−/− mice. After 4 weeks the relative engraftment of T cells was assessed (n=5).

