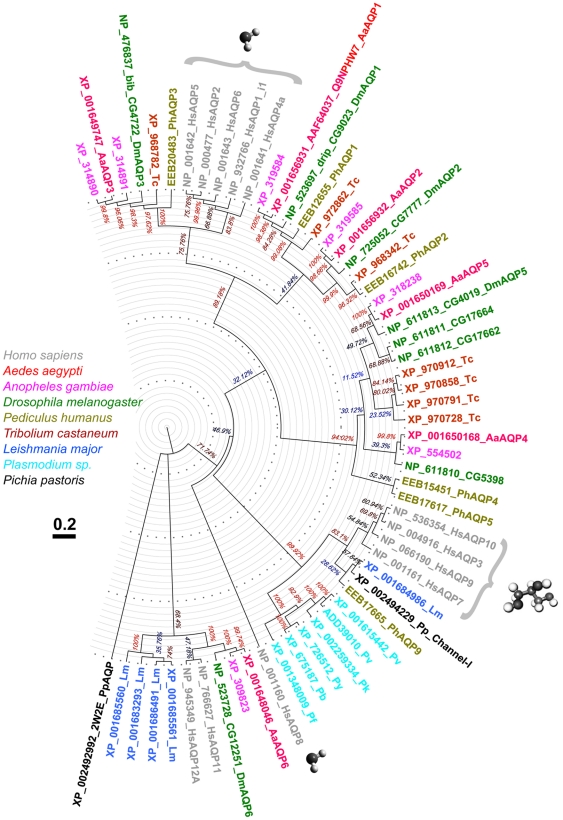
Figure 1. Evolutionary profile of Ae. aegypti AQPs.
Evolutionary relationships of AQPs from selected organisms with available sequenced genomes. The evolutionary history was inferred using the Neighbor-Joining method [43]. The bootstrap consensus tree inferred from 5000 replicates represents the evolutionary history of the taxa analyzed [44]. The tree is drawn to scale, with branch lengths in the same units as those of the evolutionary distances used to infer the phylogenetic tree. Evolutionary distances were computed using the Poisson correction method [45] and units represent the number of amino acid substitutions per site. The analysis involved 59 amino acid sequences. All ambiguous positions were removed for each sequence pair. There were a total of 236 positions in the final dataset. Evolutionary analyses were conducted in MEGA4 [46]. Initial sequence alignment was completed using PROMALS3D server (PROfile Multiple Alignment with predicted Local Structures and 3D constraints) [37]. The tree is drawn using FigTree software to an approximate 3.7 Bya-long scale with relative branch lengths used to infer the tree. AQPs from different species are color-coded. Confirmed water transporters are labeled with a water molecule, confirmed aquaglyceroporins are labeled with a glycerol molecule.

