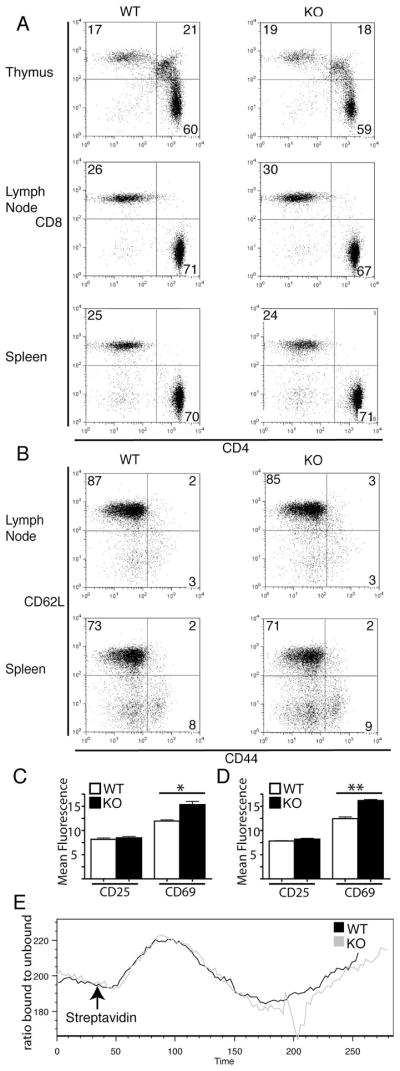
Figure 2. CD4+ T cells from PIPKIγ90 −/− mice develop normally and exhibit normal calcium responses following TCR stimulation.
Cells from lymph nodes and spleen of wild type and PIPKIγ90 −/− mice were stained with: A) CD3, CD4 and CD8 antibodies and expression of CD3+ subsets are shown. Results are representative of 3 independent experiments and 4 mice. B) CD4, CD62L and CD44 antibodies and CD4+ subsets are shown. Plot is representative of 2 independent experiments with 3 mice. C and D) CD4, CD25 and CD69 antibodies. Graphs represent normalized CD25 and CD69 fluorescent intensity +/− SEM of CD4+ cells from lymph nodes (C) and spleen (D) from 2 independent experiments with 3 mice. *=p<0.05. E) CD4+ T cells loaded with Indo-1 were coated with biotinylated anti-CD3. After acquiring baseline ratio of bound:unbound calcium, streptavadin was added to induce TCR crosslinking and change in the ratio of 405 to 495 was measured. Plot is representative of 3 independent experiments.

