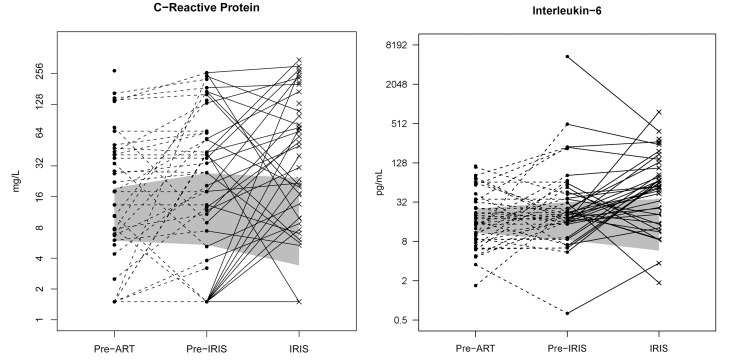
Figure 4. Individual longitudinal increases in CRP and IL-6 from baseline pre-ART, to the time point before IRIS, and at time of IRIS event.
The gray shading represents the interquartile range (25th to 75th percentile) of the CM cohort controls without IRIS over the first 8 wk of ART. The median time of IRIS was 8.8 wk. IL-6 and CRP are increased before the IRIS event (p<0.001) and at time of IRIS (p<0.001).

