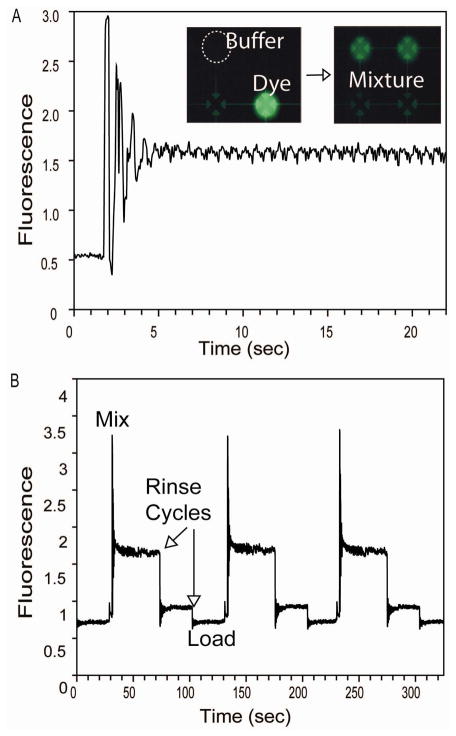
Figure 3.
(A) Confocal fluorescence data and epifluorescent images from a reagent mixing/dilution program. Fluorescein and buffer were loaded into separate valves in a 4-valve mixing circuit. Cyclic transfer of the volumes within the circuit results in rapid reagent mixing. As the fluorescein is diluted with buffer, the data follow a dampened oscillatory curve during the initial mixing phase and rapidly (<5 sec) reach equilibrium at an intermediate intensity value. (B) Three consecutive mixing operations with intermediate washing steps. These data demonstrate both the reproducibility of mixing operations and the efficiency of washing steps.

