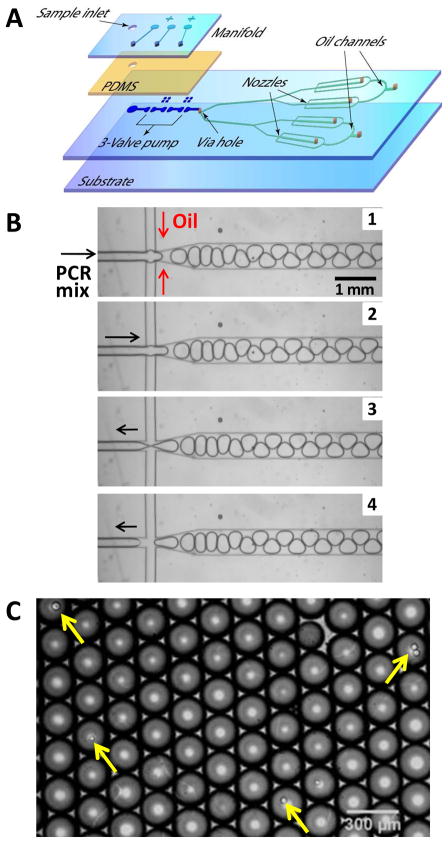
Figure 7.
(A) Exploded view of the four-layer, 4-channel MEGA device with an integrated micropump driving four parallel nozzles for droplet generation. (B) Image sequence of a cycle of droplet formation at a frequency of 5.6 Hz. PCR mix is pumped through the cross-injector and pinched by the oil flow infused from side channels (Images 1 and 2). The aqueous solution is pulled back at the end of each pumping cycle, which causes the release of the droplets (Images 3 and 4). As a result, the droplet formation is synchronized with the pump actuation, and the droplet size is determined by the flow rate of pumped fluid. (C) Optical micrograph of highly uniform droplets generated by our method containing a predictable stochastic distribution of primer-functionalized agarose beads (~34 μm, indicated by arrows). For this experiment, the average bead concentration was 0.1 beads per 3 nL droplet.

