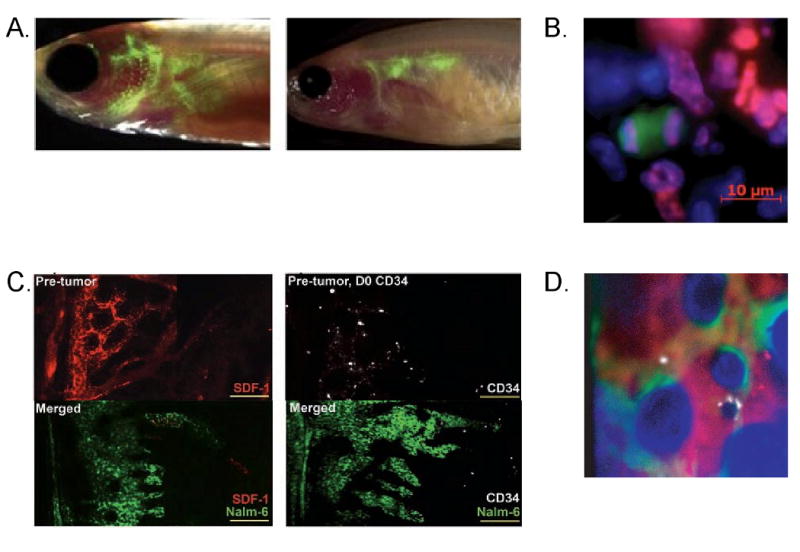
Figure 1. Imaging Hematopoietic Stem Cell Niche.

A. Green fluorescent-labeled blood cells in transparent zebrafish at 2 weeks and 4 weeks post-transplant (left and right, respectively). B. Image of dividing cells following transplantation into irradiated mice. Green cell is HSC and purple is marking the dividing nucleus. C. Changes in CXCL12 levels (red) and HSC (white) localization within bone marrow following transplantation with leukemic cells (green). Left shows decreased CXCL12 levels where the leukemic cells are present; right shows the mislocalization of transplanted human HSC. D. Localization of HSC (white), osteoblasts (green), and vasculature (red).
