Fig. 2.
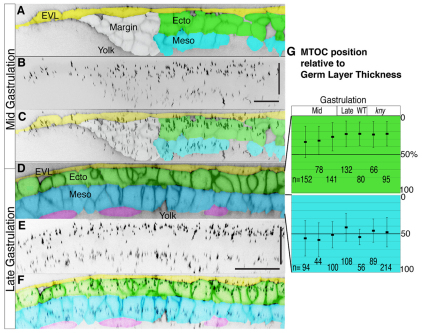
MTOC has a stereotyped position perpendicular to the germ layers during gastrulation. (A) One slice from an orthogonally reconstructed z-stack showing cells in ectoderm (green), mesoderm (blue), enveloping layer (yellow) and the involuting margin (white). MTOC position was measured in the blue and green regions. (B) Z projection shows MTOC across the lateral region revealing biased location. (C) Merge of two above images. (D) One slice from an orthogonally reconstructed z-stack showing cells in ectoderm (green), mesoderm (blue), enveloping layer (yellow) and endoderm (purple). (E) Z projection shows all the MTOC across the seven-cell wide region beside the notochord revealing biased location. (F) Merge of two above images. (G) To determine MTOC relative to germ layer thickness, orthogonal z-stacks were made so that MTOC position and germ layer thickness could be measured. MTOC in the ectoderm at 0% germ layer is at the most superficial side, while 100% germ layer is at the ecoderm/mesoderm boundary. Average position relative to germ layer is plotted, with standard deviation for individual embryos, n is number of observations from each embryo (s.e.m. is two or three). Scale bars: 30 μm.

