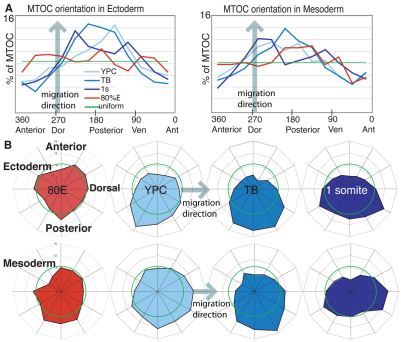
Fig. 3.
MTOC position becomes biased during gastrulation. (A) MTOC orientation in wild-type embryos, at 80% epiboly (8 hpf), yolk plug closure (10 hpf), tailbud (10.5 hpf) and one-somite stages (11.3 hpf) in ectoderm or mesoderm. Data are graphed as percentage of centrosomes in each of twelve directions. Anterior is 0, posterior is 180, dorsal is 270 and ventral is 90. The green line indicates a uniform distribution. (B) The same data are presented as radar graphs. The outermost ring of the graph is set at 16% of cells. A uniform distribution of centrosomes is indicated by the green ring (8.3%).

