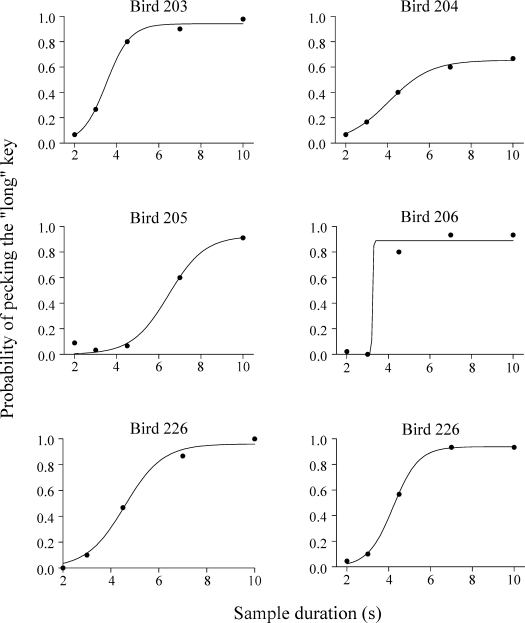
Fig 5.
Preference for the right green key, the key associated with 10-s sample, for the Trial-and-Error group. Filled circles correspond to the data from stimulus generalization test and the curves through the data points are the best-fitting logistic curves (see Equation 1). As in Figure 4, the psychometric functions combine data from training trials (2-s and 10-s samples) and test trials (2.99-s, 4.47-s and 6.69-s samples).

