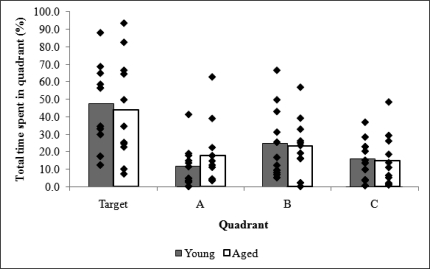
Fig 5.
Average percentage of time spent in each quadrant during the probe retention trial for aged (n = 11) and young (n = 11) breed-matched dogs and the distribution of individual scores. Quadrants were labeled: Target, the quadrant containing the learned location, and then A–C in a clockwise direction.

