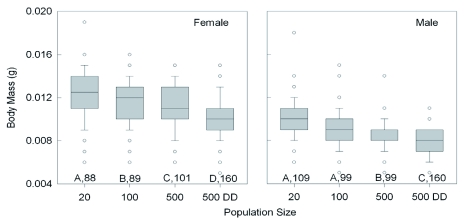
Figure 2.
Effect of increasing population size and food availability (DD = doubled diet) on the median body mass attained by female and male Lygus hesperus that had recently molted into adults. The boxplots also indicate the interquartile range, the largest non-outlier value (whiskers), and the outliers (circles). Significant differences among groups are indicated by different letters (p < 0.05, Dunn's multiple comparison test after ANOVA). Sample sizes are given. For each test condition, females massed significantly more than males (Mann-Whitney test, p < 0.01). High quality figures are available online.

