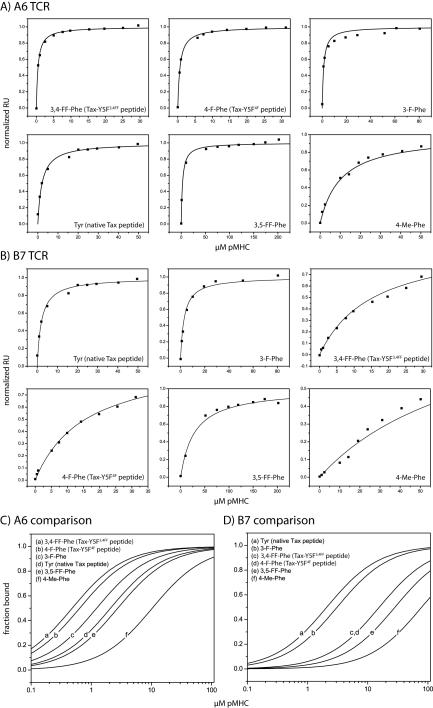
Figure 3.
Equilibrium binding data for A6 (A) and B7 (B) TCR recognition of the position 5 variant Tax peptides presented by HLA-A2. Data were collected at 25 °C and processed as described in the Experimental section. For all titrations with affinities > 10 μM, the activity of the sensor surface was determined independently using the native Tax/HLA-A2 or Tax-Y5F34FF/HLA-A2 ligand. Measured affinities are reported in Table 1. (C, D) Fitted curves from the panels in A and B plotted as a logarithmic function of pMHC concentration, illustrating the change in affinity with different peptide variants.

