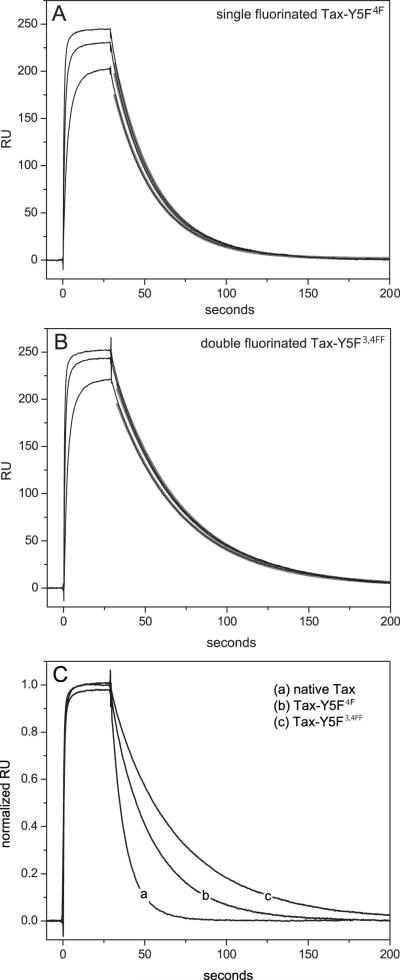
Figure 4.
Kinetic data for A6 TCR recognition of the Tax-Y5F4F (panel A) and Tax-Y5F34FF (panel B) peptides presented by HLA-A2. After correction for bulk refractive index shifts, dissociation phases were fit globally to a single exponential decay function to yield koff (gray lines in panels A and B). Panel C shows normalized kinetic data for A6 recognition of the native Tax, Tax-Y5F4F, and Tax-Y5F34FF ligands, highlighting the incremental decreases in dissociation rate with fluorination of position 5. Measured kinetics are reported in Table 2.

