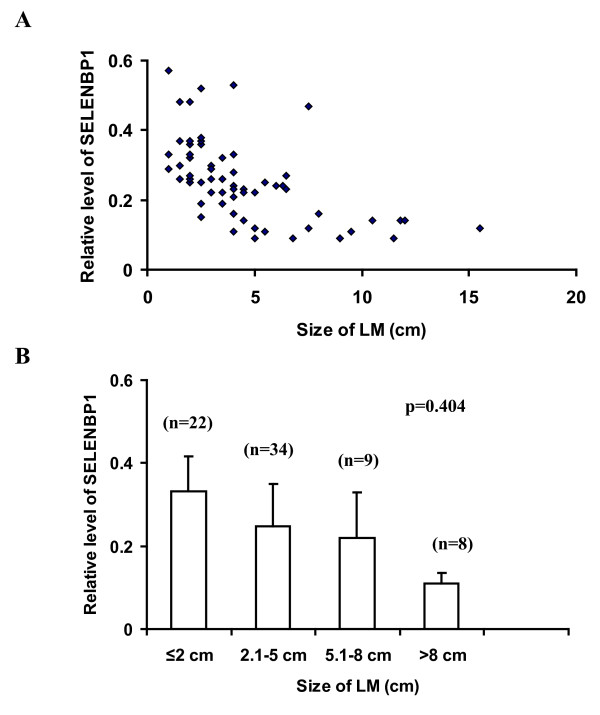
Figure 2.
Relationship between size of leiomyoma and level of SELENBP1. After normalizing for β-actin and then for the mean of SELENBP1 in normal myometrium, data derived from densitometry of Western Blot experiments were used to represent relative levels of SELENBP1. Larger leiomyomas appeared to show a lower level of SELENBP1 than smaller ones, but no statistical difference in SELENBP1 levels was found among the four arbitrary size groups. The vertical bars in B represent means and standard deviations. Abbreviations: LM, leiomyoma; MM, normal myometrium; SELENBP1, selenium-binding protein1; n, number of leiomyomas.

