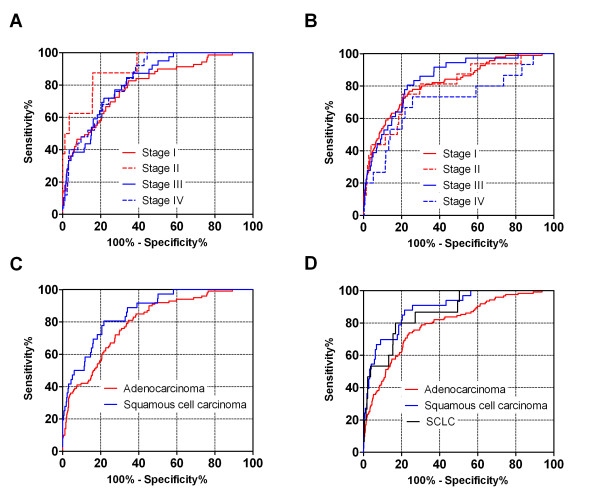
Figure 2.
ROC curves for discriminant scores subgrouped by cancer stage and histological type. A. ROC curves for cancer stage of study data set. B. ROC curves for cancer stage of test data set. C. ROC curves for histological type of study data set. D. ROC curves for histological type of test data set (including SCLC patients).

