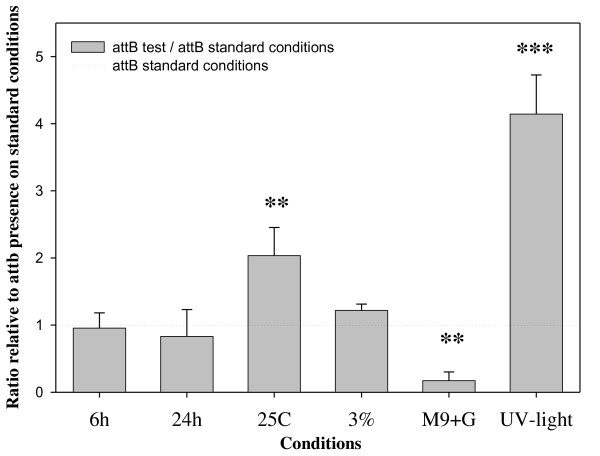
Figure 2.
Detection of VPI-2 excision by using real time quantitative PCR (QPCR) of attB levels in cell cultures grown under different conditions. The X-axis specifies culture conditions: 6 h, incubation time of 6 h; 24 h, incubation time of 24 h; 25C, incubation temperature of 25°C; 3%, the LB broth contained 3% NaCl; M9+G, cell grown on minimal media supplemented with glucose; UV-light, bacterial cultures were UV-light irradiated. The Y-axis represent the ratio of the attB presence in the cultures tested compared with cultures grown on standard conditions 12 h at 37°C in LB. Unpaired t-test was used in order to infer statistical significance for the differences in VPI-2 excision. ***, p < 0.005. **, p < 0.05. Error bars indicate standard deviation. Each experiment was performed in triplicate a minimum of three times.

