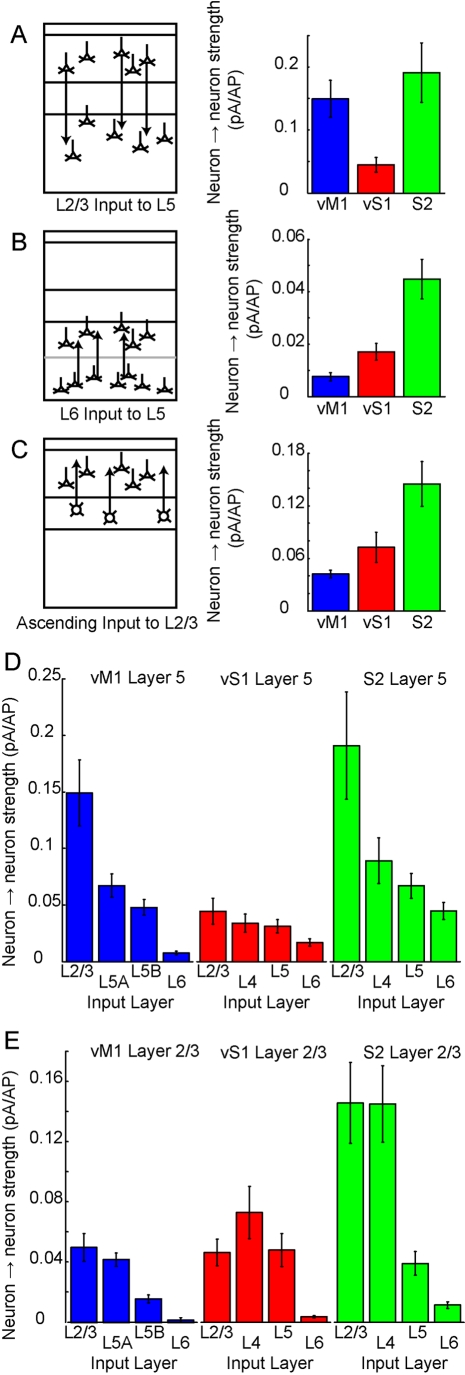
Figure 9. Quantitative comparison of neuron→neuron connectivity.
(A) Neuron→neuron pathway strength presented for vM1, vS1, and S2. Left, schematic of descending pathway from L2/3→L5. Cartoon is based on vS1 layers. Right, quantification (mean ± SD) of neuron→neuron pathway strength. Measurements of connection strength from input maps, of excitability in each cortical area, and of neuron density were resampled 10,000 times in a bootstrap analysis to determine variation (standard deviation). (B and C) Similar presentation for the ascending pathway from L6→L5 and L4→L2/3. For vM1, ascending input from L5A→L2/3 is presented in (C). (D) Quantification of all inputs to L5, presented on the same axis for comparison. (E) Quantification of all inputs to L2/3, presented on the same axis for comparison.

