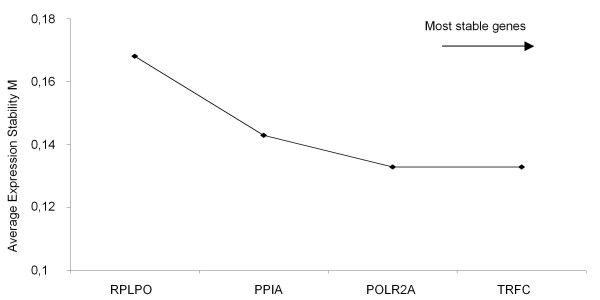
Figure 3.
GeNorm analysis of selected reference genes. Calculation of the average expression stability of the remaining 4 candidate reference genes for normalization in GIST by geNorm analysis. The least stable gene with the highest 'M'-value is indicated from left to right on the x-axis. After combining the data of the single RT-transcription cDNA and the pooled cDNA the stepwise exclusion of the least stable reference genes resulted in POLR2A and TRFC.

