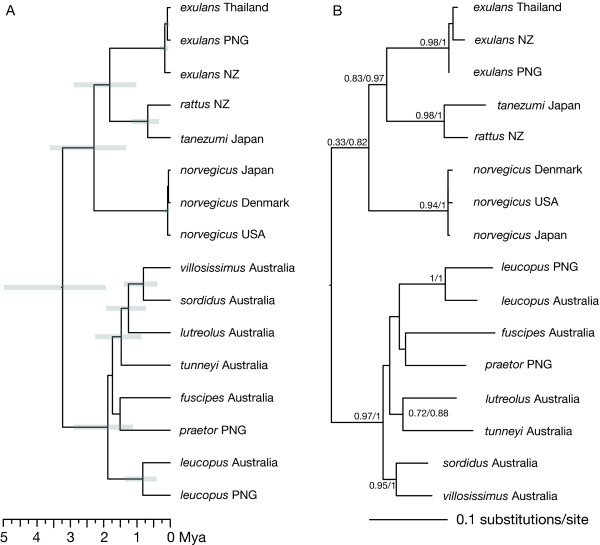
Figure 3.
(A) Bayesian Inference chronogram and (B) ML and MrBayes tree estimated for the 3G-WG dataset. The 3G-WG dataset comprises the three genomic regions (COI, CYT b and D-loop) using the same individuals as in the WG dataset. The grey bars in the chronogram (A) represent the 95% credible intervals for tMRCAs for Rattus species from BEAST. The ML and MrBayes tree (B) is labelled with bootstrap support (BS) and the Bayesian posterior probability (BPP) at each node (BS/BPP). The mouse outgroup has been removed to improve legibility.

