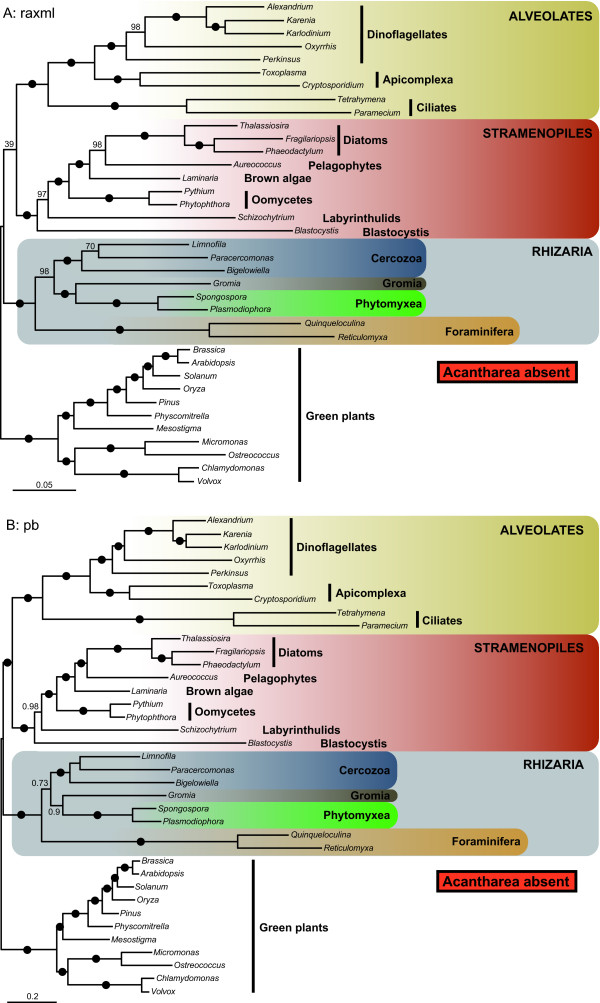
Figure 5.
Phylogeny of SAR without Acantharea. RAxML with "LG" model (A) and PhyloBayes with "CAT" model (B) phylogenies of the SAR group, rooted with the green plants. Both acantharean taxa Astrolonche sp. and Phyllostaurus sp. were removed from the alignment for inferring these trees. Black dots correspond to 100% ML bootstrap support (BP) in (A) and 1.0 Bayesian posterior probabilities (PP) in (B). Numbers at nodes represent BP (A) or PP (B) when not maximal. The scale bar represents the estimated number of amino acid substitutions per site.

