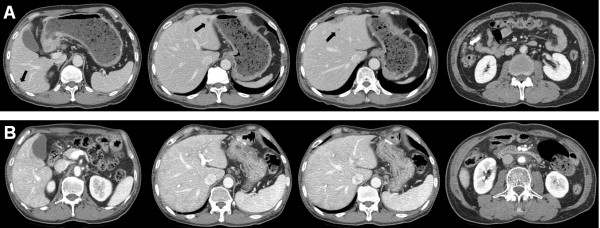
Figure 2.
Computed tomography (CT) scan (A) before and (B) after chemotherapy. (A) A CT scan showed thickening of the gastric wall, adjacent fat infiltration, and a large amount of food in the stomach, suggesting a passage disturbance. Lymph nodes along the common hepatic and left gastric arteries were markedly enlarged, and multiple enhancing omental masses (white arrow) and nodular peritoneal thickening, suggesting peritoneal carcinomatosis, and multiple hepatic metastases (black arrows) are shown. (B) Complete disappearance of thickening of the gastric wall, the metastatic foci in the liver, omental infiltration of metastatic nodules, and enlarged lymph nodes were observed.

