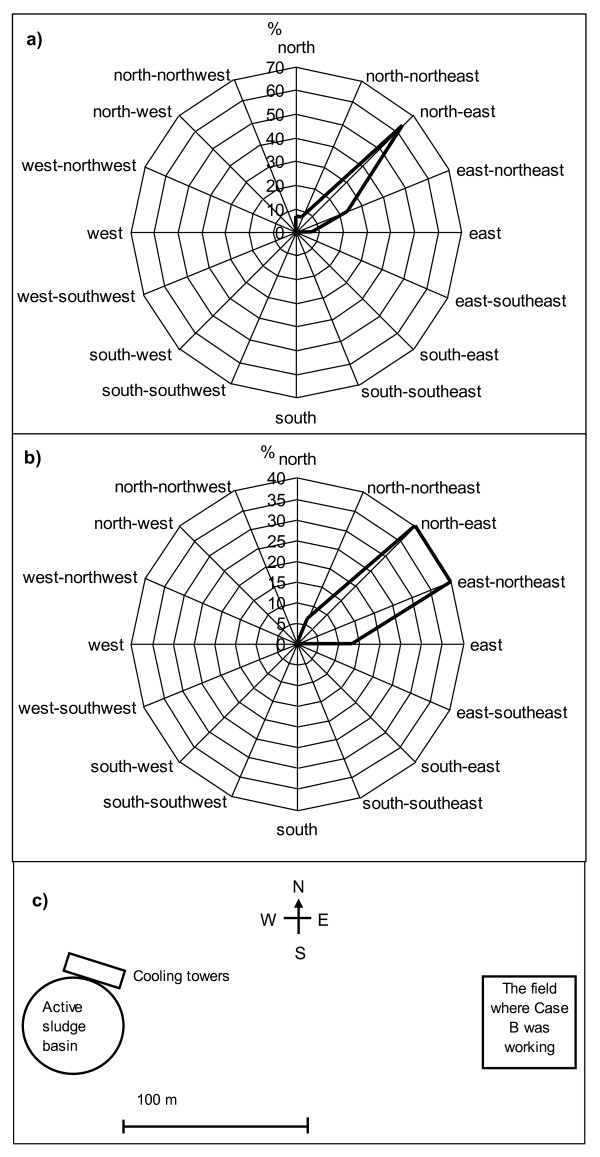
Figure 1.
Inverse wind roses (a, b) showing the direction where the wind had blown to, and location of the field where the Case B had been working, in relation to active sludge basin and cooling towers of the plant B (c). The wind data from the last working periods are drawn in separate inverse wind roses, a) is the wind data on days 4, 5 and 6 and b) on days 11, 12 and 13 days before the onset of symptoms in Case B.

