
Figure 3. Ratio between the effective potential of looping polymers and linear chains.

The data shows the ratio 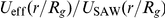 for chains of length
  and different looping probabilities
  . The data is plotted against the center-of-mass separation scaled by the radius of gyration
  of isolated polymers. The figure symbols and color codes are the same as in Figure 2.