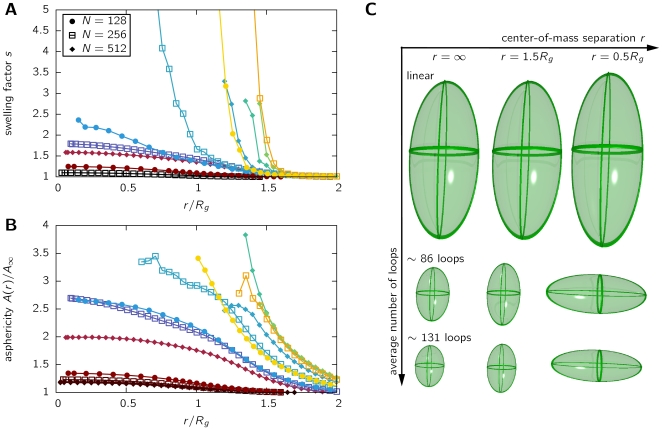
Figure 4. Structure of chromosomes being in proximity of a second one.
A. The swelling factor  of the chromosome when being at a center-of-mass separation
  compared to the isolated case. Data is shown for different chain lengths
  and looping probabilities
  . The symbols and colors used are the same as in Figure 1. B. The scaled asphericity
  for model chromosomes in proximity. The same data is used as in panel A. C. Illustrations of the average gyration ellipsoids of the chromosomes. Shown is the change in shape and size of the gyration ellipsoids for linear chains (no loops), chromosomes with an average number of 86 loops (purple symbol ▴ in Figure 2B) and chromosomes with an average number of 131 loops (cyan symbol ▴ in Figure 2B).

