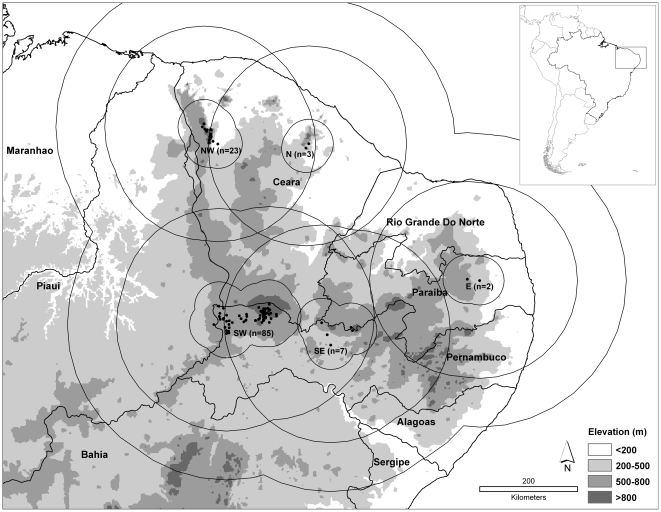
Figure 1. Overview of the area of analysis in northeastern Brazil.
Inset shows geographic location. Map shows the five plague foci in the region and known plague occurrences (black dots), each with its respective 50 km and 200 km testing regions (see Methods). Shading indicates elevation, as follows: white = <200 m, light gray = 200–500 m, medium gray = 500–800 m, and dark gray = >800 m.

