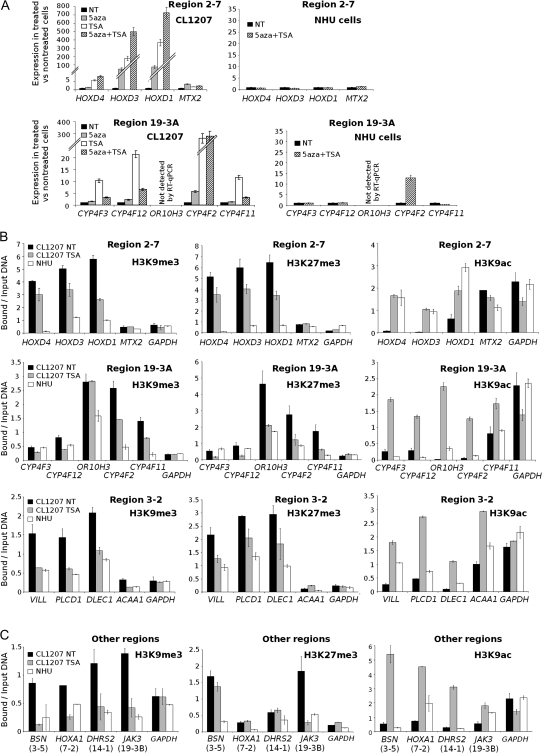
Figure 3.
Epigenetic silencing mechanisms in regions of decreased expression. A) Effect of 5-aza-deoxycytidine (5aza) and TSA treatments on gene expression in CL1207 human bladder tumor cells vs normal human urothelial (NHU) cells. Gene expression was measured by real-time quantitative polymerase chain reaction (RT-qPCR) in RNA from CL1207 cells before (NT) and after treatment with the DNA demethylating agent 5aza, the histone deacetylase inhibitor TSA, or both and in RNA from NHU cells before (NT) and after treatment with both 5aza and TSA. Results are shown for two regions, region 2-7 (upper panels) and region 19-3A (lower panels) (for additional data for all other regions, see Supplementary Figure 2, available online). For each treatment, RT-qPCR analyses were performed in two independent experiments, with each qPCR performed in duplicate. Results are expressed as the ratio between expression in treated cells and in untreated cells. The error bars indicate the variance between the means of the two independent experiments. Treatments were scored as having an effect if there was a greater than 1.5-fold change between treated and untreated cells. B) Histone marks in regions 2-7, 19-3A, and 3-2 in chromatin from CL1207 cells in the presence or absence of TSA treatment and from untreated NHU cells. Histone marks associated with the promoters of silenced genes (H3K9me3 and H3K27me3) or expressed genes (H3K9Ac) were investigated by chromatin immunoprecipitation (ChIP) assays. ChIP assays were performed for all promoters in regions 2-7 (upper panels), 19-3A (middle panels) and 3-2 (lower panels), using antibodies against posttranslational modifications of histone H3: trimethyl lysine 9 (H3K9me3; left panels), trimethyl lysine 27 (H3K27me3; middle panels) and acetyl lysine 9 (H3K9ac; right panels). The bar graph shows the amount of immunoprecipitated target DNA, expressed as a percentage of total input DNA, measured in duplicate by qPCR. Levels of H3K9me3 and H3K27me3 in the promoter of the ubiquitously expressed GAPDH gene served as a negative control in chromatin from both cell types. The error bars indicate the variance between the means of two independent experiments. C) Histone marks in regions 3-5, 7-2, 14-1, and 19-3B in chromatin from TSA-treated or untreated CL1207 cells and from untreated NHU cells. In all other regions that presented a stretch of coordinately silenced genes that were re-expressed after TSA or 5aza treatment, experiments were done as in (B) except that ChIP assays were performed for only one gene promoter per region (eg, the promoter of BSN for region 3-5, HOXA1 for region 7-2, DHRS2 for region 14-1, and JAK3 for region 19-3B).

