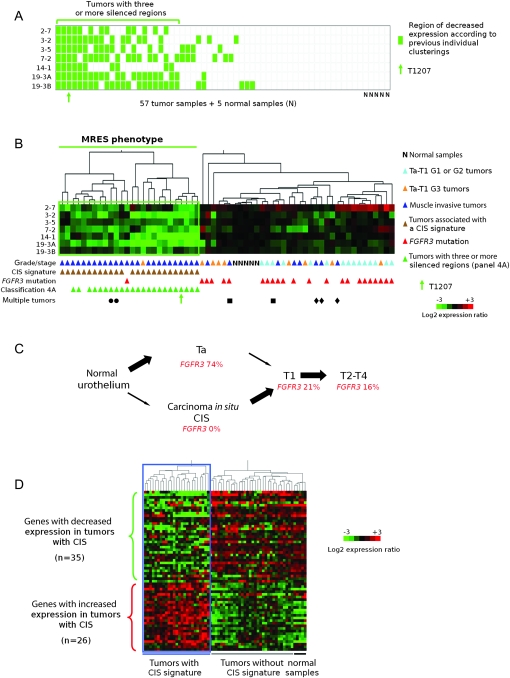
Figure 4.
Presence of a multiple regional epigenetic silencing (MRES) phenotype in bladder cancer and its relationship to the two pathways of bladder tumor progression. A) Determination of the number of epigenetically silenced regions for each tumor in the set of 57 bladder tumors. This panel was deduced from the cluster analysis data in Figure 1 for each of the seven epigenetically controlled regions (regions 2-7, 3-3, 3-5, 7-2, 14-1, 19-3A, and 19-3B). Each row represents a chromosomal region, and each column a tumor or normal sample. For each tumor, decreased expression of a given chromosomal region (ie, placement within the green box in Figure 1) is denoted by a green rectangle, whereas equal or increased expression is denoted by a white rectangle. Twenty-three tumors (those below the horizontal green line) displayed decreased expression of at least three regions. The position of tumor T1207 is indicated by a green arrow. B) Cluster analysis of 57 tumor samples and five normal samples according to the level of gene expression in the seven epigenetically silenced regions. Samples are clustered according to their regional expression scores, which correspond to the average levels of gene expression in each region (see “Methods”). Tumors that displayed decreased expression in several regions (below the horizontal green line) define a MRES phenotype. All samples are annotated with their stage and grade, presence or absence of a carcinoma in situ (CIS)-associated gene expression signature (Figure 4, D) and their FGFR3 mutation status. Tumors that had at least three chromosomal regions with decreased gene expression in Figure 4, A are also indicated. The tumors from the three patients with multiple tumors are indicated by three different symbols. The patient indicated by a circle had two synchronous T3-G3 tumors. The patient indicated by a square had one T2-G2 primary tumor and then a T1-G2 tumor. The patient indicated by a diamond had three synchronous T4-G3 tumors. The cluster analysis was not affected by the exclusion of regional expression scores for tumors displaying genetic loss in the corresponding region (data not shown). C) Schematic representation of the two pathways of bladder cancer progression. In bladder cancer, two different pathways can lead to invasive tumors: the superficial Ta tumor pathway, which rarely leads to progression, and the CIS pathway, in which the superficial lesions (CIS) are high grade and very often progress to lamina propria–invasive T1 and then to muscle-invasive T2-T4 tumors (29). The percentages of FGFR3 mutations at the different stages of tumor progression in the two pathways are taken from reference (30). D) Separation of the 57 bladder tumors according to the CIS-associated gene expression signature previously defined by Dyrskjøt et al. (31). Sixty-one of the 100 genes reported by Dyrskjøt et al. were represented on the Affymetrix array used (U95A). Of these 61 genes, 26 corresponded to genes with increased expression and 35 to genes with decreased expression in bladder cancers that had the CIS-associated signature compared with those that did not (31). The 62 samples (57 tumor samples and five normal urothelial samples) clustered into two groups with respect to the CIS-associated gene expression signature.

