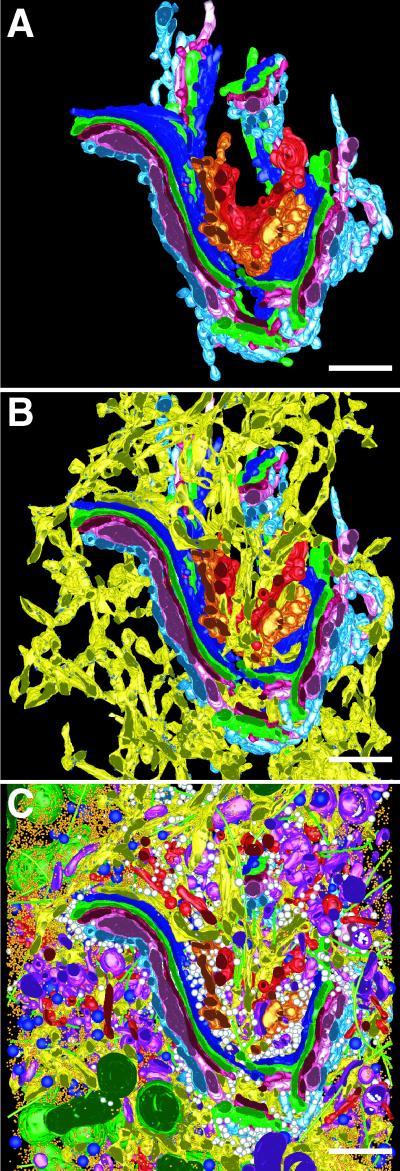
Figure 2.
3-D model of the Golgi region. By using the software imod, each modeled object could be extracted and viewed in any given orientation and in context with any other object(s) to analyze complex morphologies with minimal ambiguity. (A) The seven cisternae that comprise the Golgi in the region modeled. C1, light blue; C2, pink; C3, cherry red; C4, green; C5, dark blue; C6, gold; C7, bright red. (B) The ER (yellow) traverses the Golgi stack at multiple points and extends in opposite directions beyond the cis-most and trans-most cisternae. (C) The Golgi displayed in the context of all organelles, vesicles, ribosomes, and MTs visible by EM in the modeled region. ER, yellow; membrane-bound ribosomes, blue; free ribosomes, orange; MTs, bright green; dense core vesicles, bright blue; clathrin-negative vesicles, white; clathrin-positive compartments and vesicles, bright red; clathrin-negative compartments and vesicles, purple; mitochondria, dark green. Bars = 500 nm.

