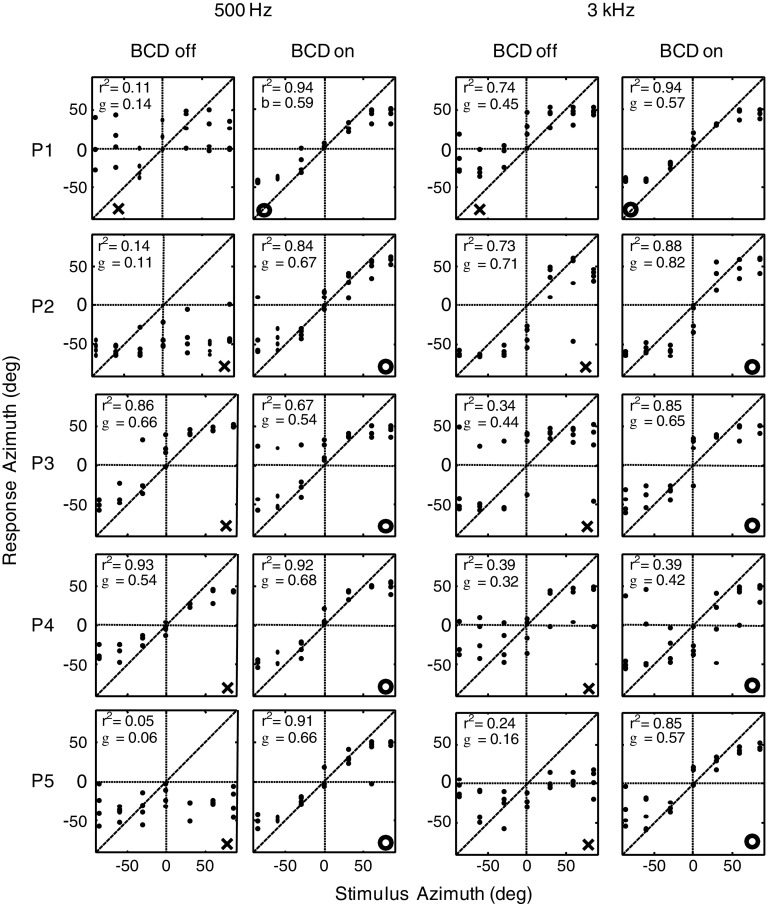
FIG. 3.
Sound localization responses for patients P1–P5. Responses are plotted for the 500-Hz and 3-kHz stimuli in the unaided (BCD-off) and aided (BCD-on) conditions. Note that two patients (P3 and P4) did not benefit from the BCD system when they had to localize 500-Hz stimuli, as they had already fairly good localization of 500-Hz stimuli in the unaided condition. Two other patients (P1 and P2) demonstrated a surprisingly good unaided localization of 3-kHz stimuli. r 2 = coefficient of determination, b = response gain. X indicates the hearing-impaired side. Empty circle indicates the side of the BCD.

