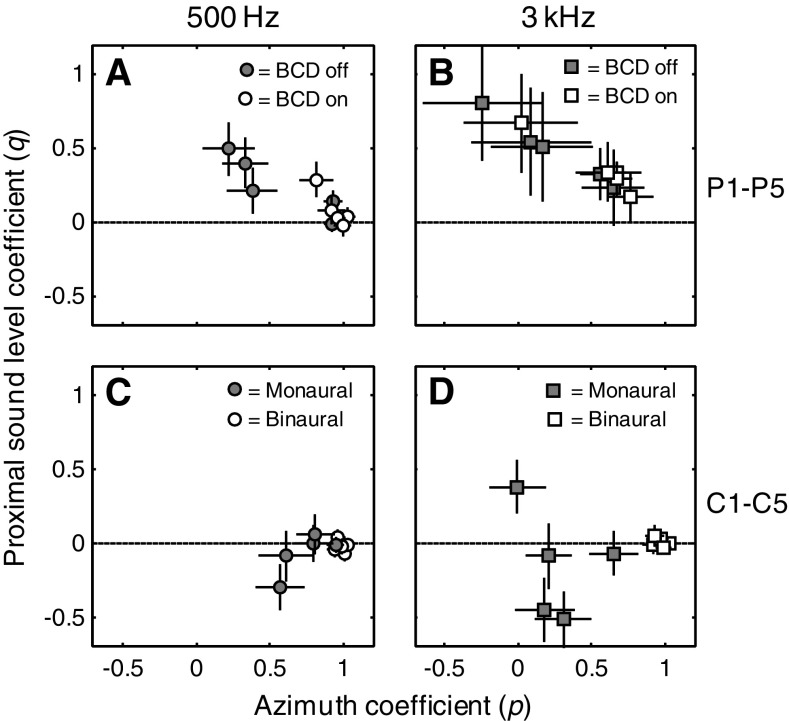
FIG. 6.
Multiple linear regression analysis of monaural and binaural azimuth localization performance for 500-Hz (circles, left) and 3-kHz (squares, right) noises of patients P1–P5 and control listeners. The coefficients for proximal sound level (q in Eq. 2) and azimuth (p in Eq. 2) are plotted against one another for each patient (A and B) and control listener (C and D). For clarity, data points with a proximal sound level coefficient of zero are slightly shifted. Note that most patients have an azimuth coefficient close to one in the aided condition, except patient P4 who demonstrates a high sound level coefficient for 3-kHz stimuli.

