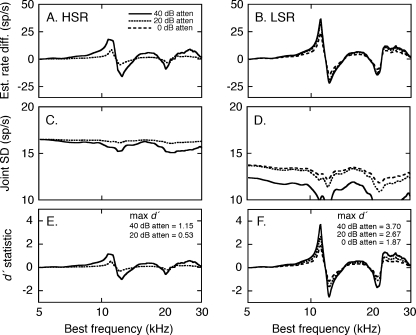
FIG. 13.
Signal detection analysis of the quality of HRTF representations in background noise. A, B Differences in the discharge rates elicited by the EL +15° and EL +30° HRTFs were estimated by applying the linear rate-level relationships in Figure 11 to the two spectral shapes (see Fig. 6). C, D Joint SDs were derived by inserting the rate profiles into Eq. 2. E, F The d′ index of discrimination for the two HRTFs is computed from the ratio of rate differences and joint SDs.

