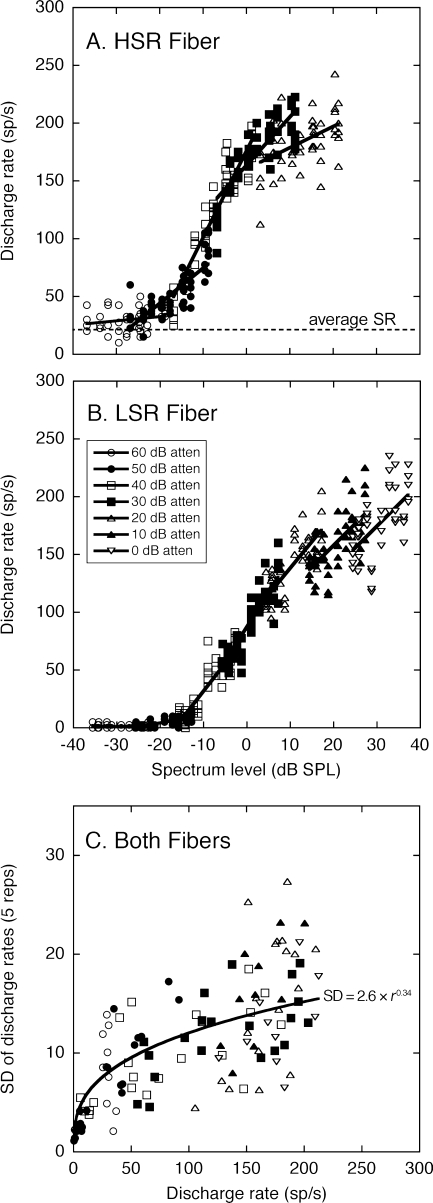
FIG. 2.
HRTF-driven rates for representative auditory nerve fibers with high (A) and low spontaneous rates (B). Rates are plotted relative to the on-BF spectrum level of the ten HRTFs in Figure 1. Each HRTF was presented five times at presentation levels that are indicated by symbol type. Data from the same presentation level have been fit with first-order polynomials (lines). Standard deviations (SDs) of the discharge rates (C) were based on repetitions of the same HRTF and presentation level. These data are plotted relative to the average discharge rate of the five repetitions. The relationship between rate and variance replicates the previous results of May and Huang (1997), which are indicated by the power function and equation.

