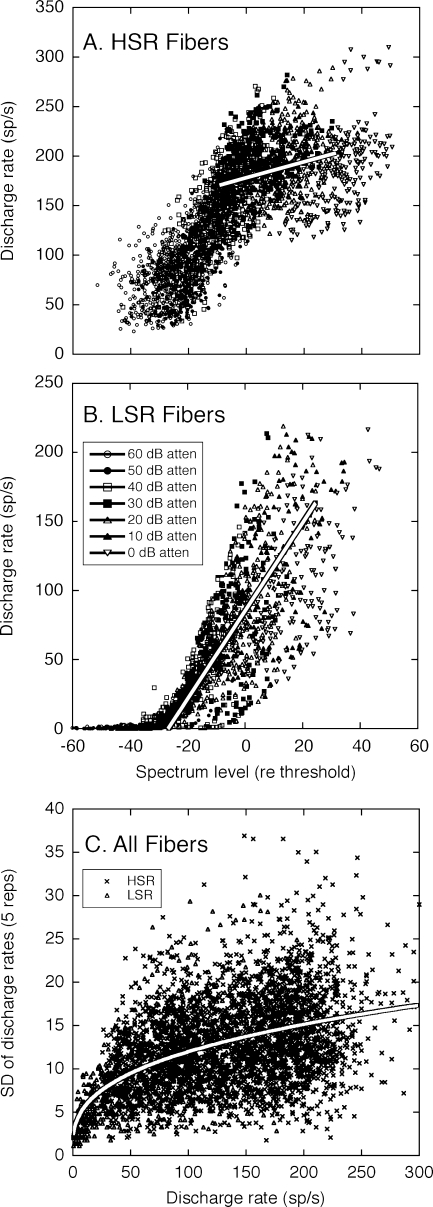
FIG. 3.
The complete population of HRTF-driven rates for high (A) and low spontaneous rate fibers (B), and the standard deviations (SDs) of those rates (C). Plotting conventions are described in Figure 2 except that spectrum level is specified relative to each fiber’s threshold to compensate for differences in sensitivity. Linear fits have been performed on rate-level data from both groups of fibers at a presentation level of 20 dB attenuation. The power function relating SD to average discharge rate was originally derived by May and Huang (1997).

