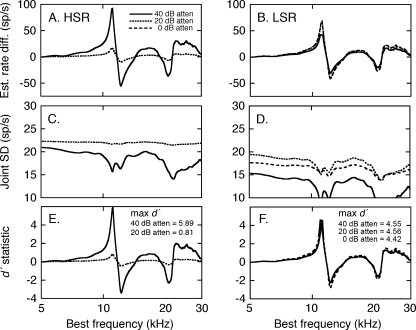
FIG. 7.
Signal detection analysis of the quality of HRTF representations under quiet conditions. HRTF-dependent rate differences were calculated for HSR (A) and LSR fibers (B) by subtracting the simulated rates for the EL +15° HRTF from the rates for the EL +30° HRTF (Fig. 5). The joint SDs for HSR (C) and LSR fiber (D) were derived from the estimated SD profiles for the two stimuli (Fig. 6). The d′ index of discrimination (E and F) reflects the ratio of the rate difference and joint SD, as specified by Eq. 1.

