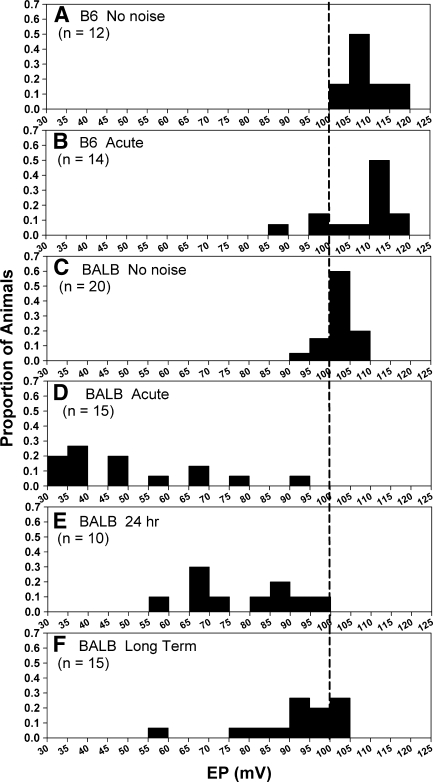
FIG. 4.
A–F Distribution of basal turn EPs in B6 and BALB mice with and without noise exposure. Data are the same as those used to derive means and statistical results shown in Figure 3. BALBs are examined at various times after noise as shown. Vertical line marks 100 mV to aid comparisons. Data were derived by dividing the number of animals in each bin by sample size for each group, so that bin height indicates the proportion falling within a particular EP range.

