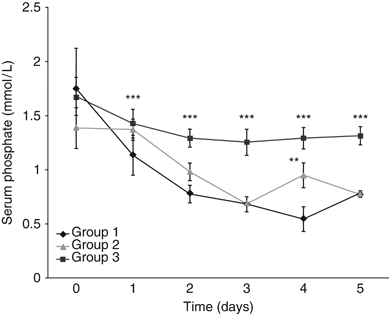
Fig. 2.

Serum phosphate levels during the continuous renal replacement therapy treatment. Group 1, receiving Hemosol B0 (diamond), group 2, receiving the phosphate-containing dialysis fluid as the dialysis fluid and Hemosol B0 as the replacement fluid (triangle), and group 3, receiving the phosphate-containing dialysis fluid (square). Groups 2 and 3 were statistically compared with group 1. n=14 patients/group, **P<0.01, ***P<0.001.
