
Fig. 3.
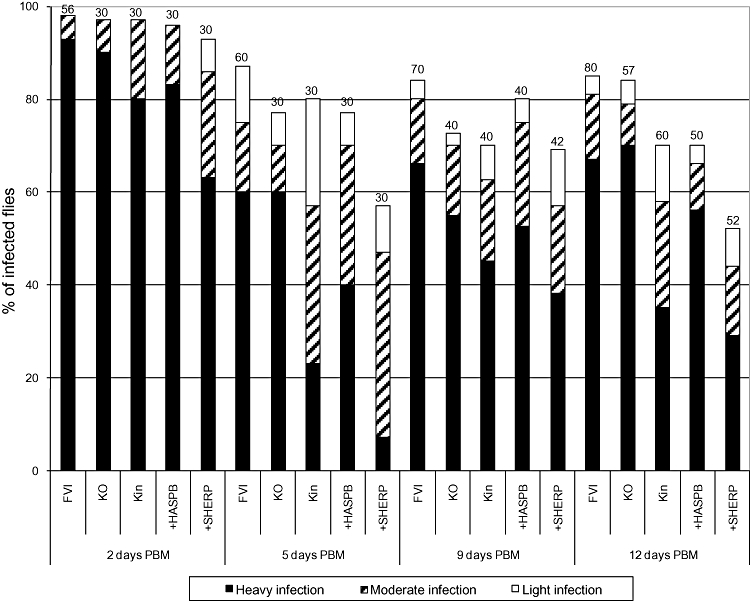
Rates and intensities of infections with five L. major lines in P. papatasi. The parasite lines analysed were as follows: FVI, L. major Friedlin wild type; KO, ΔcDNA16::HYG/ΔcDNA16::PAC; Kin, ΔcDNA16::HYG/ΔcDNA16::PAC/ΔPAC::cDNA16; +HASPB, as in Fig. 1C; +SHERP, as in Fig. 1C. Sand fly females were infected by feeding through a chick-skin membrane on a suspension of 106 parasites ml−1 of rabbit blood and dissected 2, 5, 9 and 12 days PBM. Gut infections were graded as light (< 100 parasites per gut), moderate (100–1000 parasites per gut) or heavy (> 1000 parasites per gut) as described in Experimental procedures. Infection experiments were repeated four times for combinations of wild-type (FVI), KO and Kin lines and twice for combinations of FVI, +HASPB and +SHERP lines. Differences between lines were evaluated using the chi-square test: day 2 PBM, P = 0.068, χ2 = 19.953, d.f. = 12; day 5 PBM, P < 0.0001, χ2 = 40.657, d.f. = 12; day 9 PBM, P = 0.344, χ2 = 13.357, d.f. = 12; day 12 PBM, P < 0.0001, χ2 = 41.544, d.f. = 12. Numbers above each bar, number of flies analysed.