
Table 1.
Location of parasites in P. papatasi infected with the lines described in Fig. 3.
| Days PBM | Leishmania line |
 Endoperitrophic space Endoperitrophic space |
 AMG only AMG only |
 AMG and TMG AMG and TMG |
 AMG, TMG and cardia AMG, TMG and cardia |
 Colonized SV Colonized SV |
|---|---|---|---|---|---|---|
| 2 | FVI | 100 | 0 | 0 | 0 | 0 |
| KO | 100 | 0 | 0 | 0 | 0 | |
| Kin | 100 | 0 | 0 | 0 | 0 | |
| +HASPB | 100 | 0 | 0 | 0 | 0 | |
| +SHERP | 100 | 0 | 0 | 0 | 0 | |
| 5 | FVI | 0 | 11.5 | 42.3 | 44.2 | 1.9 |
| KO | 0 | 8.7 | 34.8 | 56.5 | 0.0 | |
| Kin | 0 | 20.8 | 45.8 | 33.3 | 0.0 | |
| +HASPB | 0 | 26.1 | 30.4 | 43.5 | 0.0 | |
| +SHERP | 0 | 17.6 | 47.1 | 35.3 | 0.0 | |
| 9 | FVI | 0 | 5.1 | 13.6 | 39.0 | 42.4 |
| KO | 0 | 3.4 | 6.9 | 89.7 | 0.0 | |
| Kin | 0 | 17.9 | 10.7 | 50.0 | 21.4 | |
| +HASPB | 0 | 3.1 | 15.6 | 46.9 | 34.4 | |
| +SHERP | 0 | 3.4 | 37.9 | 48.3 | 10.3 | |
| 12 | FVI | 0 | 4.4 | 4.4 | 30.9 | 60.3 |
| KO | 0 | 6.3 | 18.8 | 72.9 | 2.1 | |
| Kin | 0 | 14.3 | 9.5 | 38.1 | 38.1 | |
| +HASPB | 0 | 2.9 | 5.7 | 34.3 | 57.1 | |
| +SHERP | 0 | 0.0 | 18.5 | 59.3 | 22.2 |
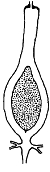
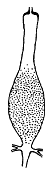
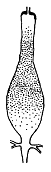
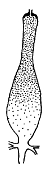
Leishmania infections in the sand fly digestive tract at 2, 5, 9 and 12 days PBM were analysed by dissection and examination by light microscopy. The % of infected flies found in each location is shown. AMG, abdominal midgut; TMG, thoracic midgut; SV, stomodeal valve.