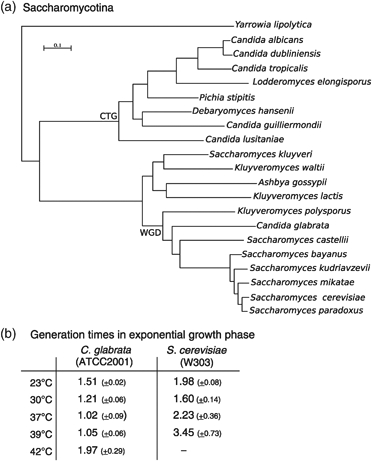
Fig. 1.

(a) Phylogenetic tree representing the evolutionary relationships between sequenced Candida and Saccharomyces species (adapted from T21 tree in Marcet-Houben & Gabaldón, 2009). The tree is based on the maximum likelihood analysis of concatenated alignments of 1137 protein families that have single-copy orthologues in the 21 species considered. Approximate likelihood ratio test support values were >0.95 for all branches, except for the one joining Debaryomyces hansenii and Candida guilliermondii (0.25). The genetic code transition in the CTG clade and the WGD events are indicated in the tree. (b) Generation time of Candida glabrata and Saccharomyces cerevisiae strains at different growth temperatures based on OD600 nm measurements during exponential growth phase in rich medium (three experiments, SDs in parentheses).
