Figure 3.
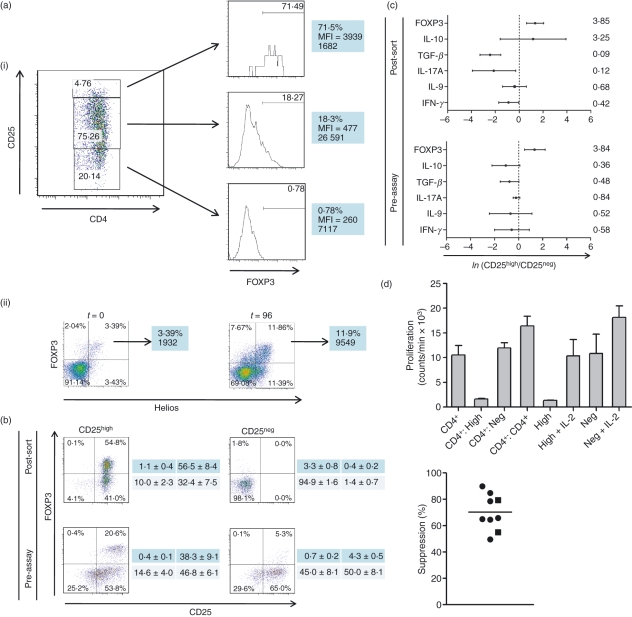
Peripheral CD4+ CD25high FOXP3high T cells in the dog show a regulatory phenotype and suppressive function in vitro. Following activation of mononuclear cells with concanavalin A (Con A) and interleukin-2 (IL-2; 10 U/ml), FACS™ was used to sort the 5% of CD4+ T cells with the highest and the 20% of CD4+ T cells with the lowest CD25 expression. (A 5% rather than a 2% gate was chosen to optimize both FOXP3 enrichment and numbers of cells sorted for functional assays.) The CD25high cells were consistently enriched in cells expressing FOXP3 relative to the CD25intermediate or CD25− (CD25neg) cells [a(i)]. The histograms show respective expression of FOXP3 of each population, with median fluorescence intensity (MFI) and absolute cell counts; these results are representative of seven independent experiments. The 96-hr (t = 96) activation protocol increased the proportion and absolute number of FOXP3+ Helios+ cells, as revealed by co-staining with the anti-murine/human Helios monoclonal antibody 22F6 [a(ii)]. (b) The phenotype of CD4+ T cells from a dog both immediately following FACS™ (‘post-sort’) and on the day of CD25high and CD25neg cell admixture following pre-activation with Con A, for the purposes of the regulatory T-cell assay (‘pre-assay’). The CD4+ CD25high fraction, in this case approximately 55% FOXP3+, retains a population of FOXP3high cells at the point of admixture, whereas the CD25neg fraction contains only a small population of FOXP3intermediate cells, likely to represent activated conventional T cells. The tables to the right of the dot plots show respective summary data (mean ± SEM [%]) for each of the quadrants from five independent experiments. Reverse-transcription quantitative polymerase chain reaction (RT-qPCR) assays (c) reveal that the ‘post-sort’ CD25high T cells show greater expression of transcripts encoding FOXP3 and IL-10; greater expression of FOXP3 is also evident at the point of admixture of the cells (‘pre-assay’). All RT-qPCR assays were performed on lymph-node-derived cells and qPCR data are expressed as the natural logarithm (ln) of the ratio of gene expression Ct difference of CD25high : CD25neg cells, normalized to β2-microglobulin; mean and standard deviation ln expression ratios are depicted, with geometric mean ratios shown on the right of the figure (n= 4). (An ln expression ratio of 0 represents equally abundant transcript in both populations). When the cells depicted in (b) were co-cultured with activated third party responder CD4+ T cells at a 1 : 1 ratio, the CD4+ CD25high T cells were able to suppress the proliferation of the responder cells, whereas the CD4+ CD25neg cells showed no suppressive properties (d). When cultured alone, the CD4+ CD25high T cells showed anergy that could be broken by the addition of IL-2 (20 U/ml), while the CD4+ CD25neg cells proliferated robustly with or without exogenous IL-2. Control co-cultures of CD25high or CD25neg CD4+ T cells maintained in complete medium without Con A admixed with similarly unstimulated third-party CD4+ T cells showed only background counts, ruling out any influence of a mixed leukocyte reaction. Error bars indicate standard errors of the mean of triplicate cultures (CD4+ T cells and co-cultures) or (difference in values/2) for duplicate monocultures of CD25high or CD25neg T cells. The figure to the right of the panel summarizes proportional suppression of proliferation for nine independent experiments; square symbols represent assays performed on peripheral blood mononuclear cells, circles represent assays performed on lymph node-derived cells, and the horizontal line indicates the mean value. (All co-culture assays were performed on cells derived from beagles.)

