
Figure 6.
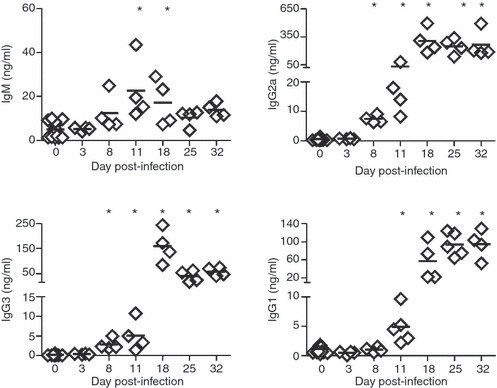
Immunoglobulin production by spleen cells from Trypanosoma cruzi-infected mice. IgM and IgG isotype concentrations, determined by ELISA, in culture supernatant of splenic cells obtained from normal (day 0) or T. cruzi-infected mice at different days post-infection. Diamonds represent the value obtained from each mouse. The lines represent the median value in each analysed group. The significant difference between normal (day 0) and infected mice is indicated by * (P< 0·05). Results are representative for four individual experiments.